A Hydrologic Perspective from MSI Hydrologist and Associate Director of the Water Program Jake Kurzweil
The flooding events of the past two weeks have left deep scars on our San Juan Mountain communities. Our thoughts are with all of those who have been affected and we are committed as an organization to supporting, not just now, but through long-term recovery. We are inspired by and thankful for the many volunteers and responders who are continuing to show up for our neighbors in need to move flows away from homes, shovel sediment, house friends and strangers, share meals, and so much more. We are proud to be part of these strong communities.
From a hydrologic perspective, this was an incredible event and as a science organization we wanted to provide some context. The bottom line is that our watersheds were simply overwhelmed by back to back large precipitation events. With this second round of storms, there was nowhere for the record setting levels of rain to go except into the overflowing rivers and out into the floodplains, flooding our communities. The Mancos River near Towaoc hit its highest flow in over 100 years and the Animas River, as measured at Cedar Hill, broke the previous 1949 flow record.
So what happened and how are we measuring it?
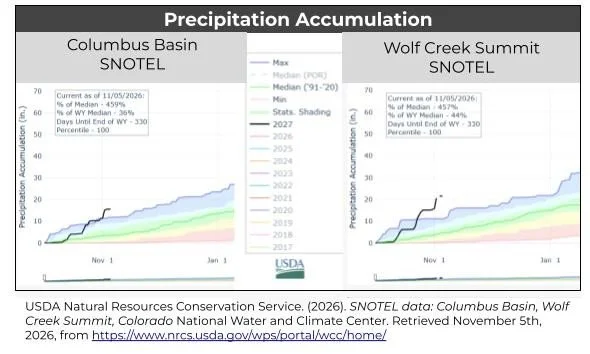
The November 1st storm hit the La Platas and Wolf Creek Pass hard. The Columbus Basin SNOTEL site, located in the La Plata Mountains, hit a new record for October precipitation after the first storm that ended October 25th, receiving 5.8 inches of rain in just 5 days. The November 1st storm dropped an additional 4.6 inches of rain in a single day. Based on the NOAA Point Precipitation Frequency Estimates, this puts this rainfall event at just above a 200-year event, or a probability of 0.5% of happening in any given year. Comparatively, Silverton only saw 2 inches of rain. That’s why tributaries coming off the La Platas, like Hermosa and Junction Creek or the Mancos River, were hit first and harder than the Animas itself. Meanwhile, the Wolf Creek Summit SNOTEL saw 15 inches of precipitation with 5.7 inches of mostly rain on November 1st, just shy of a 200-year event.
Overland flow can only happen when surface water depressions are filled and when soils are saturated or unable to keep up with rainfall intensity. Rain creates soil moisture which helps feed deeper aquifers, in turn providing groundwater to our rivers via base flow. However, when rainfall intensity, the rate at which the rain is falling, exceeds the soil infiltration rate, the rate at which soils can absorb water, there is infiltration-excess overland flow (Hortonian overland flow if you like naming things after people.) Heavy rains can trigger overland flows even in dry systems when the intensity exceeds infiltration. In the case of sustained rain, like these back to back events, if the soil is fully saturated or the groundwater is sufficiently elevated, there may be nowhere for the water to infiltrate, leaving more rainfall to run off the surface. This process is called saturation-excess overland flow, or Dunne overland flow. Both types of overland flow were at work in the flood last week.
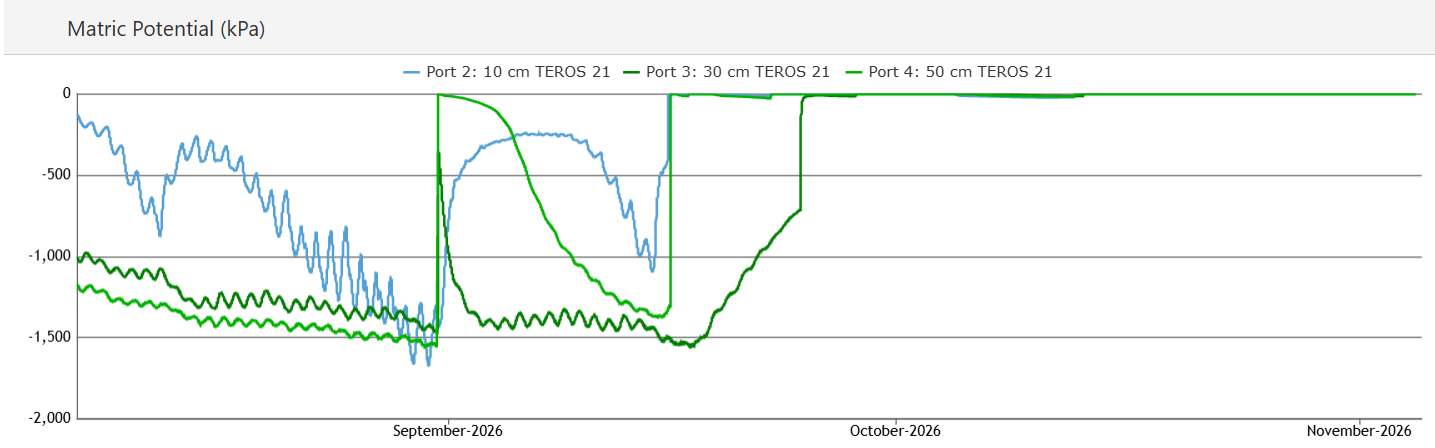
At a snowtography site just outside of Mancos in the Chicken Creek area, MSI monitors soil moisture at three depths. Blue is at 10 cm, dark green is 20 cm, and light green is 100 cm deep. The sensors capture how difficult it is for plants to pull water from the soil. Large negative kilopascals indicate dry soils, while zero indicates more saturated conditions. The graph below shows soils drying out in August after a weak monsoon season. Then we see two events, one in late August and another in the middle of September that saturate soils at all depths. The soils were barely starting to dry just as the October storms hit and fully saturated the soils again. Come November 1st, there was no room for additional rainfall to further infiltrate soils, creating conditions for high overland flows.
So what happened to flow and how did the flow stack up to recorded history? To answer this, I calculated return intervals based on current and historic data. A return interval is a representation of the probability of a given flow event being exceeded given the distribution of the flow data. Put another way a 2-year event has a 50% chance of occurring or being exceeded in any given year, a 10-year event a 10% chance, and a 100-year event has a 1% chance. Over time a 100-year event becomes more probable, for example there is an 18% of a100-year event occurring or being exceeded over a 20 year period. Beyond that, there are many different ways you can evaluate a return interval (for nerds like me, I followed USGS methods and used a log distribution to fit my cumulative distribution function). Unfortunately, many gages in the area stopped working due to record flows, so I prioritized gages that not only made it through the storm, but also have long data records.
First, I evaluated the Mancos River Near Towaoc gage. Other gages in town failed early in the storm and were more recently installed, while the Towaoc gage provided daily averages all the way back to 1921. Historic flows were captured only using daily averages, so that will be the best comparison. The daily average peaked on November 3rd at 3,460 cfs - the actual peak was 5,450 cfs. This was the largest event recorded in over 100 years, and my calculations estimate that this was a 212-year event with a .47% probability of occurring or being exceeded in any given year. This event surpassed the previous record for daily average of 3,050 cfs on 10/13/1941.
On the Aminas, the in town gage only dates back to the 80’s, so I evaluated the downstream gage of Animas River Near Cedar Hill, which extends back to 1933. For the data sleuths, there was a four-hour window when this gage went down, and likely missed the peak, but it’s what we have to work with. Using daily average values again, we saw a peak flow of 20,400 cfs on November 2nd, dwarfing the past record of 11,800 cfs on 6/18/1949. My estimates put this at a 1,163-year event for that station or a .08% probability of flows exceeding this value in any given year. This is an estimate and not peer reviewed, but that’s a wild number!
To summarize, this was a historic event powered by historic levels of rainfall, saturated soils, and very high snowlines that prevented precipitation from being locked up high as snow. Hug your loved ones, thank your neighbors, and thanks for reading.